ENVIRONMENTAL MONITORING ON WALK BRIDGE
The Connecticut Department of Transportation has implemented environmental protection measures to safeguard the natural environment during WALK Bridge. One of these measures is the installation of monitoring stations and devices near each construction site.
Measuring water quality, NOISE AND VIBRATION
Construction activity can be potentially disruptive, so CTDOT monitors the water quality in the Norwalk River and noise and vibration levels at construction sites to ensure they comply with acceptable federal and state levels. Should any readings spike, the data can be reviewed, reported and resolved quickly.
water quality
The Norwalk River water quality naturally fluctuates throughout the day/year, and the WALK Bridge team verifies that the construction impact remains within acceptable limits beyond what happens naturally and is caused by routine marine traffic.
The data may show high readings due to unforeseen weather events, such as high rainfall and high winds, and during low and high tides.
![]()
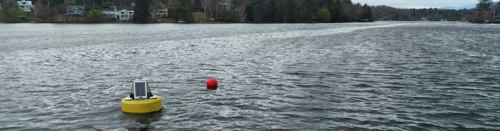
The WALK Bridge team monitors water quality by measuring turbidity levels, which is water clarity or cloudiness, during construction activities, such as dredging or pile driving.
Monitoring locations may vary as needed to reflect the current in-water work locations.
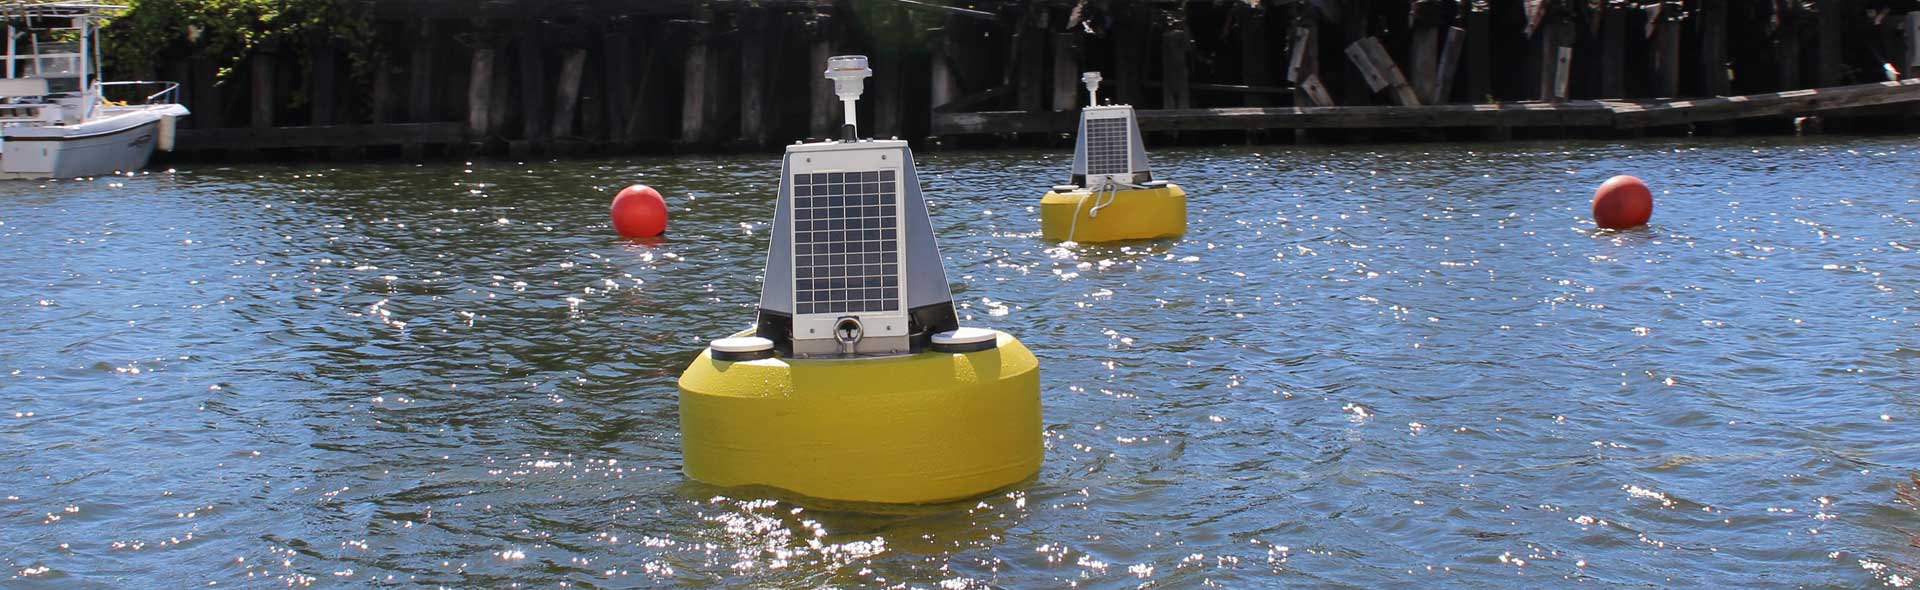
Equipment
Two NexSens CB-450 Data Buoys and two pole-mounted X2 models are being used to monitor turbidity on the WALK Bridge project. Turbidity is a measurement of cloudiness in the water. These devices are designed for rivers, coastal waters and harbors. The Data Buoys are optimized for use with the X2 data loggers, which send readings in real-time on an internet browser using a smartphone, tablet, or PC. The readings refresh every 15 minutes and are available on the WALK Bridge project website. The two non-stationary buoys will move from their locations depending on construction activities.
Understanding the data

Data Buoys measure the amount of light scattered by suspended particles in Nephelometric Turbidity Units (NTU), providing continual information during construction activity sites in the Norwalk River.
The live alerts refresh every 15 minutes. For reference, drinking water is generally between 0-5 NTUs.
The Norwalk River water quality naturally fluctuates throughout the day/year, and the WALK Bridge team verifies that the construction impact remains within acceptable limits beyond what happens naturally and is caused by routine marine traffic.
The data may show high readings due to unforeseen weather events, such as high rainfall and high winds, and during low and high tides.
Based on the results of the WALK Bridge Test Pile Program in 2018-2019, it was determined that the turbidity impacts specific to the pile driving and removal operations were minimal compared to baseline conditions. Per the Connecticut Water Quality Standards (effective February 25, 2011, and adopted October 10, 2013), Class SB and Class SA Waters do not have a minimum turbidity threshold "other than of natural origin except as may result from... construction activity, ...dredging activity or discharge of dredged or fill materials provided all reasonable controls and Best Management Practices are used to control turbidity and none exceeding levels necessary to protect and maintain all designated uses."
In-Water Work Windows
Dredging will be conducted within a turbidity curtain between December 1 and January 31. Dredging from February 1 through November 30 will be conducted within a marine enclosure enclosed by a turbidity curtain.
Pile driving and extraction (including sheet piles) activities conducted between April 1 and June 30 will only occur between one hour after sunrise to one hour before sunset.
All pile driving and extraction (including sheet piles) activities conducted between March 16 and October 31 will have a soft start at the beginning of each shift and following cessation of activity for 30 minutes or longer.
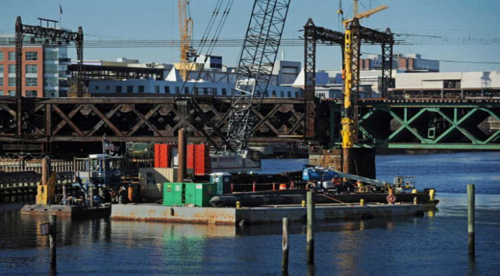
Vibration Monitoring
![]()
The WALK Bridge team monitors vibration during construction activities, such as drilling or pile driving. Monitoring stations continuously collect peak particle velocity (PPV) daily.

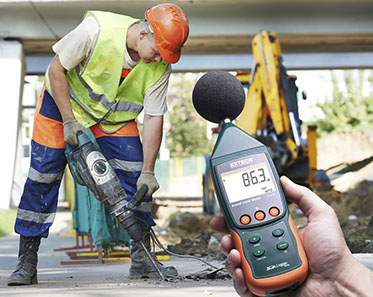
Noise Monitoring
![]()
The project monitors noise levels not to exceed the maximum permitted state levels (90db). Monitors collect data continuously during project construction-related activities. Noise exceedances may arise from traffic, such as trucks and other social conditions unrelated to the project. Instantaneous readings may sometimes exceed the 90db – but the applicable standard is a time-weighted average.